Event Date
Event Date
Link to a Map
Register Here
Instructor: Dr. Oliver Fiehn, UC Davis
- Required Software: None
- Participant prerequisites: None
- Level: Introductory
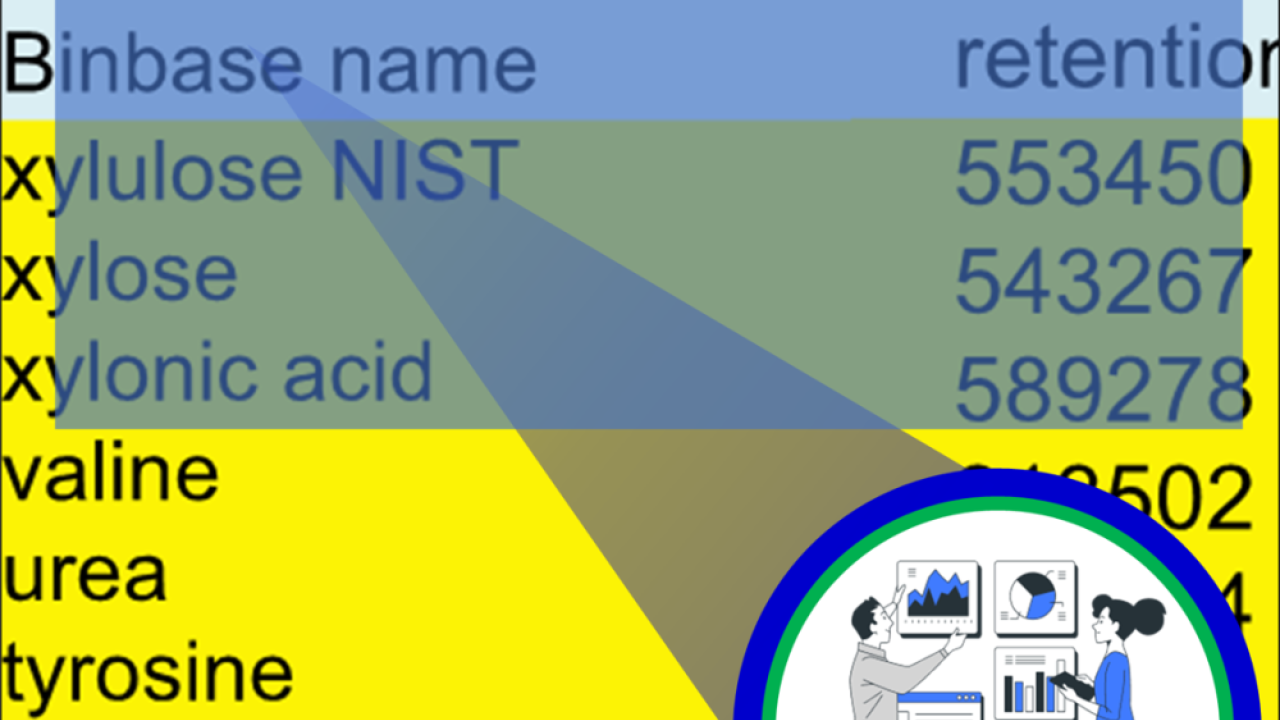
- Short description of the course: What do you do after you have completed statistics? How do you map and visualize your data? This short course will focus on helping you interpret data, generate hypotheses, integrate biological and metabolomics data, and make the most of freely available online databases. We will provide practical tips on curation, data mapping, and visualization.